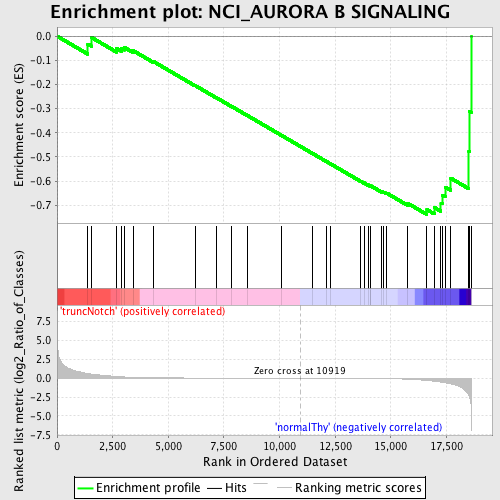
Profile of the Running ES Score & Positions of GeneSet Members on the Rank Ordered List
| Dataset | Set_03_truncNotch_versus_normalThy.phenotype_truncNotch_versus_normalThy.cls #truncNotch_versus_normalThy.phenotype_truncNotch_versus_normalThy.cls #truncNotch_versus_normalThy_repos |
| Phenotype | phenotype_truncNotch_versus_normalThy.cls#truncNotch_versus_normalThy_repos |
| Upregulated in class | normalThy |
| GeneSet | NCI_AURORA B SIGNALING |
| Enrichment Score (ES) | -0.73814195 |
| Normalized Enrichment Score (NES) | -1.5305756 |
| Nominal p-value | 0.0175 |
| FDR q-value | 0.3744315 |
| FWER p-Value | 0.969 |
| PROBE | DESCRIPTION (from dataset) | GENE SYMBOL | GENE_TITLE | RANK IN GENE LIST | RANK METRIC SCORE | RUNNING ES | CORE ENRICHMENT | |
|---|---|---|---|---|---|---|---|---|
| 1 | NCL | 2360463 4540279 | 1380 | 0.615 | -0.0329 | No | ||
| 2 | NSUN2 | 2120193 | 1556 | 0.542 | -0.0059 | No | ||
| 3 | AURKA | 780537 | 2673 | 0.224 | -0.0509 | No | ||
| 4 | VIM | 20431 | 2895 | 0.181 | -0.0506 | No | ||
| 5 | EVI5 | 6380040 | 3021 | 0.163 | -0.0464 | No | ||
| 6 | PPP2R5D | 4010156 380408 5550112 5670162 | 3414 | 0.116 | -0.0597 | No | ||
| 7 | AURKB | 5890739 | 4354 | 0.060 | -0.1062 | No | ||
| 8 | BUB1 | 5390270 | 6199 | 0.021 | -0.2040 | No | ||
| 9 | KIF2C | 6940082 | 7152 | 0.014 | -0.2543 | No | ||
| 10 | STMN1 | 1990717 | 7825 | 0.010 | -0.2898 | No | ||
| 11 | NDC80 | 4120465 | 8579 | 0.007 | -0.3299 | No | ||
| 12 | AURKC | 4060687 | 10102 | 0.002 | -0.4116 | No | ||
| 13 | KLHL13 | 6590731 | 11471 | -0.002 | -0.4851 | No | ||
| 14 | NPM1 | 4730427 | 12090 | -0.004 | -0.5181 | No | ||
| 15 | DES | 1450341 | 12278 | -0.004 | -0.5279 | No | ||
| 16 | CBX5 | 3830072 6290167 | 13651 | -0.014 | -0.6008 | No | ||
| 17 | SMC2 | 4810133 | 13794 | -0.016 | -0.6073 | No | ||
| 18 | MYLK | 4010600 7000364 | 13974 | -0.019 | -0.6157 | No | ||
| 19 | KIF20A | 2650050 | 14099 | -0.021 | -0.6210 | No | ||
| 20 | RACGAP1 | 3990162 6620736 | 14104 | -0.021 | -0.6199 | No | ||
| 21 | SMC4 | 5910240 | 14588 | -0.035 | -0.6435 | No | ||
| 22 | KIF23 | 5570112 | 14673 | -0.039 | -0.6454 | No | ||
| 23 | SGOL1 | 1980075 5220092 6020711 | 14817 | -0.047 | -0.6499 | No | ||
| 24 | CUL3 | 1850520 | 15767 | -0.131 | -0.6922 | No | ||
| 25 | BIRC5 | 110408 580014 1770632 | 16622 | -0.299 | -0.7180 | Yes | ||
| 26 | CENPA | 5080154 | 16958 | -0.400 | -0.7092 | Yes | ||
| 27 | NCAPH | 6220435 | 17254 | -0.512 | -0.6907 | Yes | ||
| 28 | PPP1CC | 6380300 2510647 | 17310 | -0.536 | -0.6576 | Yes | ||
| 29 | INCENP | 520593 | 17446 | -0.603 | -0.6244 | Yes | ||
| 30 | RASA1 | 1240315 | 17696 | -0.741 | -0.5880 | Yes | ||
| 31 | RHOA | 580142 5900131 5340450 | 18507 | -2.308 | -0.4766 | Yes | ||
| 32 | CDCA8 | 2340286 6980019 | 18533 | -2.465 | -0.3123 | Yes | ||
| 33 | PSMA3 | 5900047 7040161 | 18612 | -4.714 | 0.0002 | Yes |

